0 Daily Users
Engaging with PowerGPT
0 Conversations
Completed Today
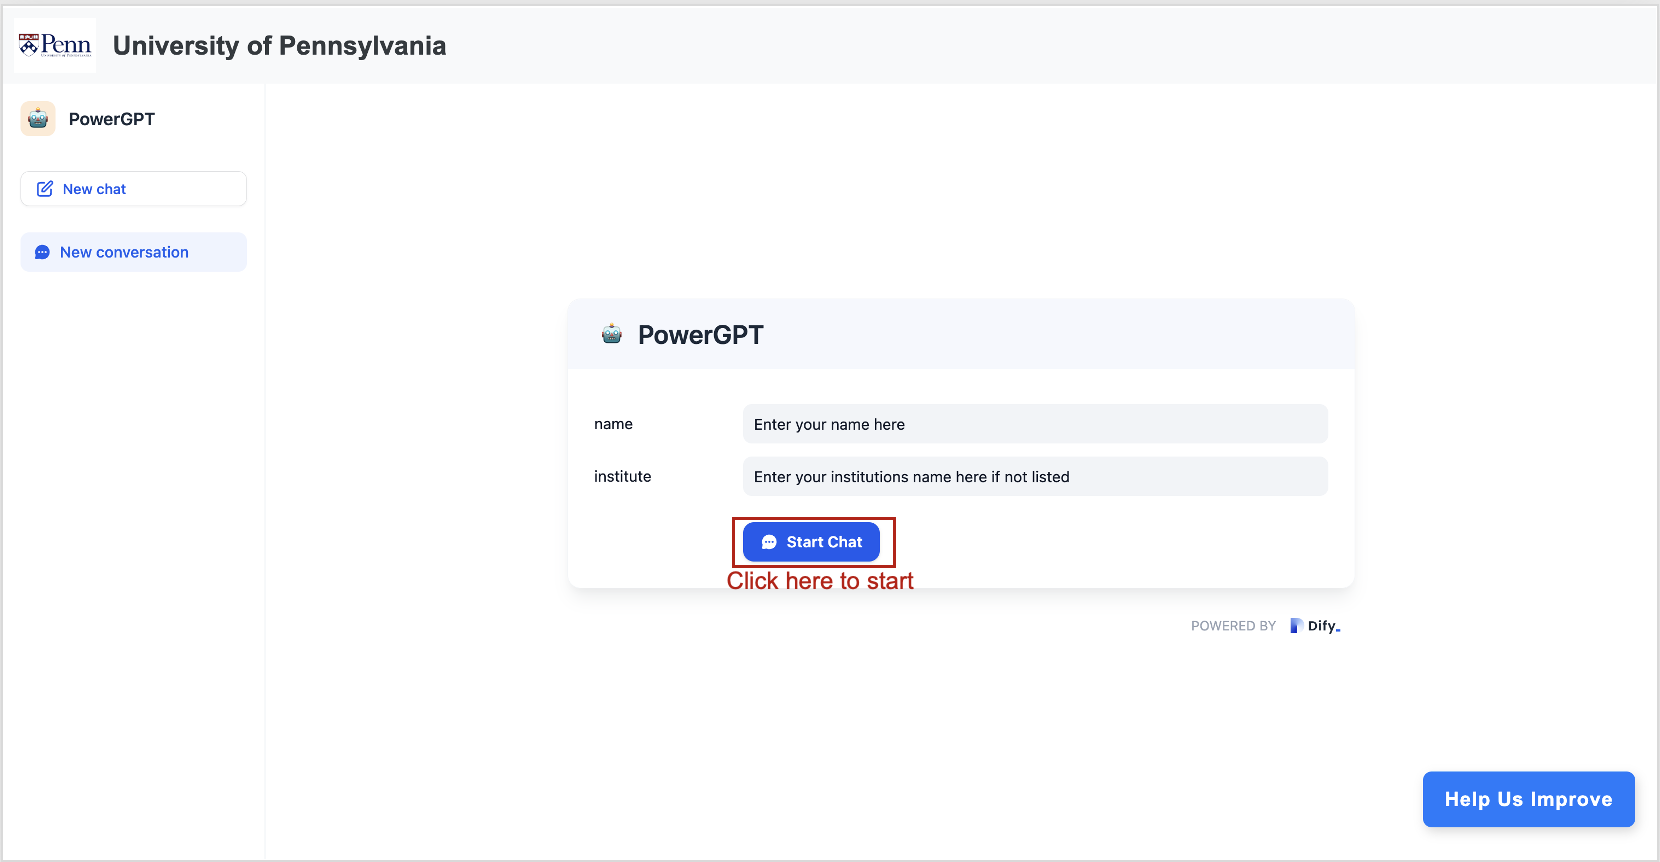
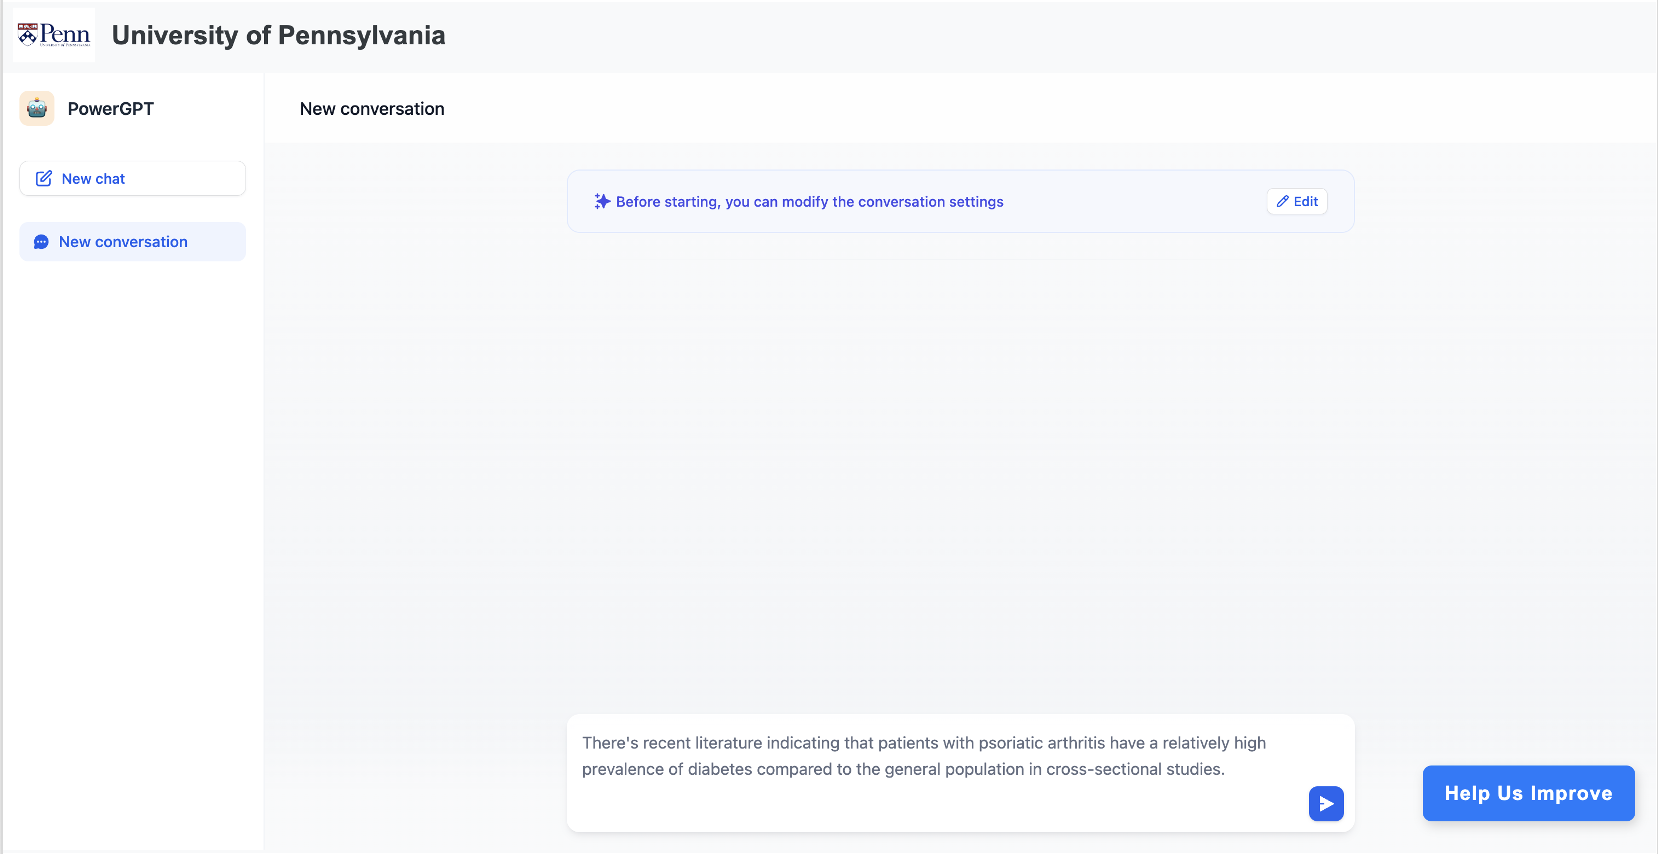
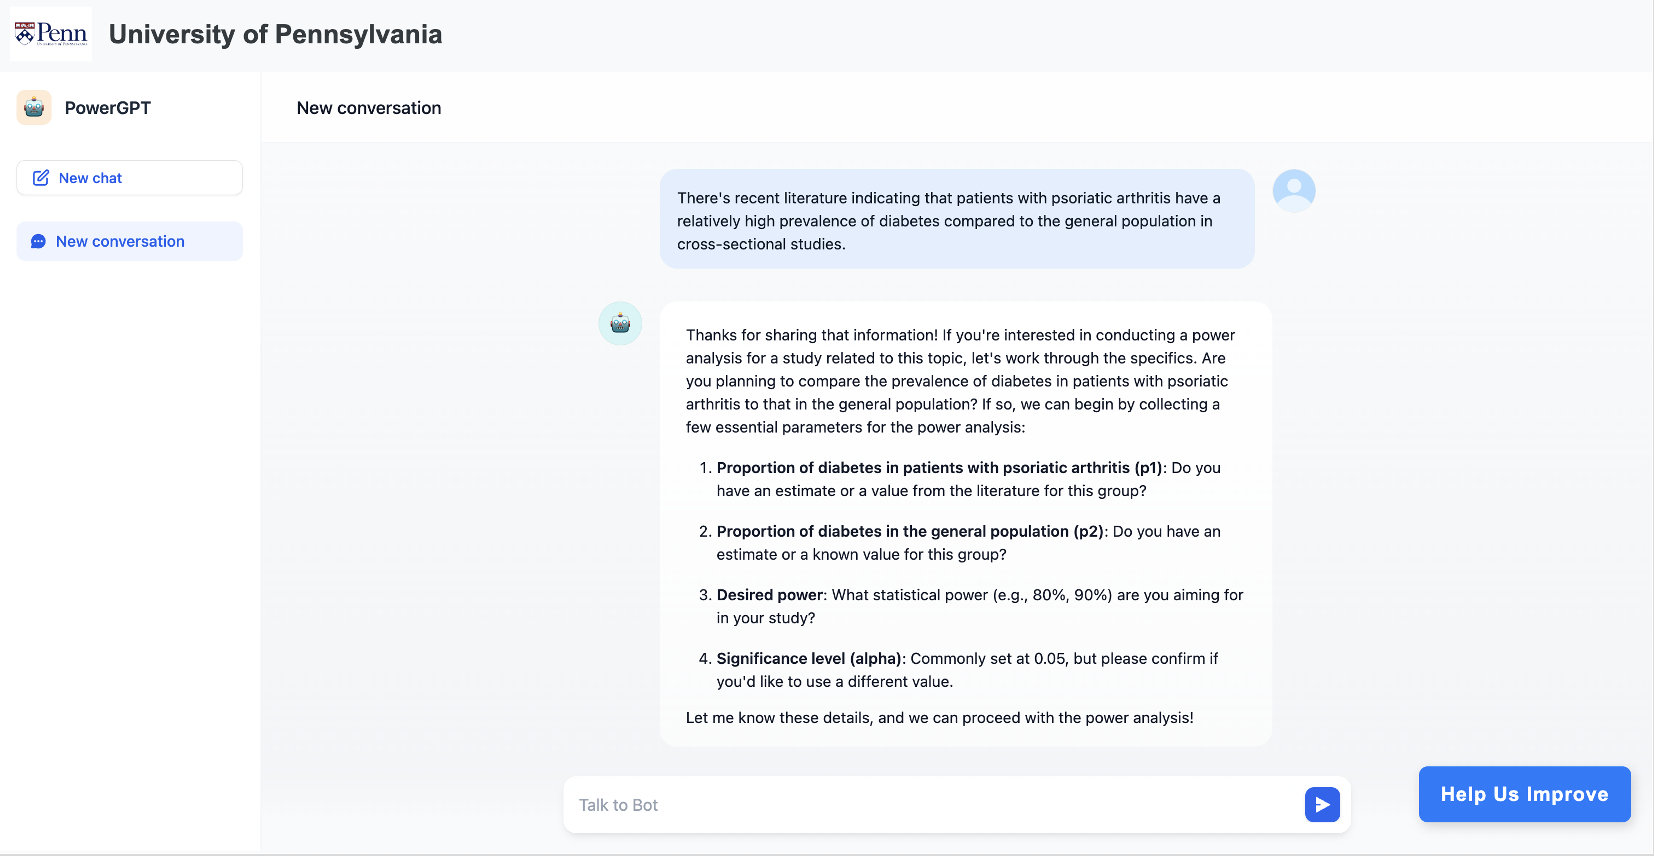
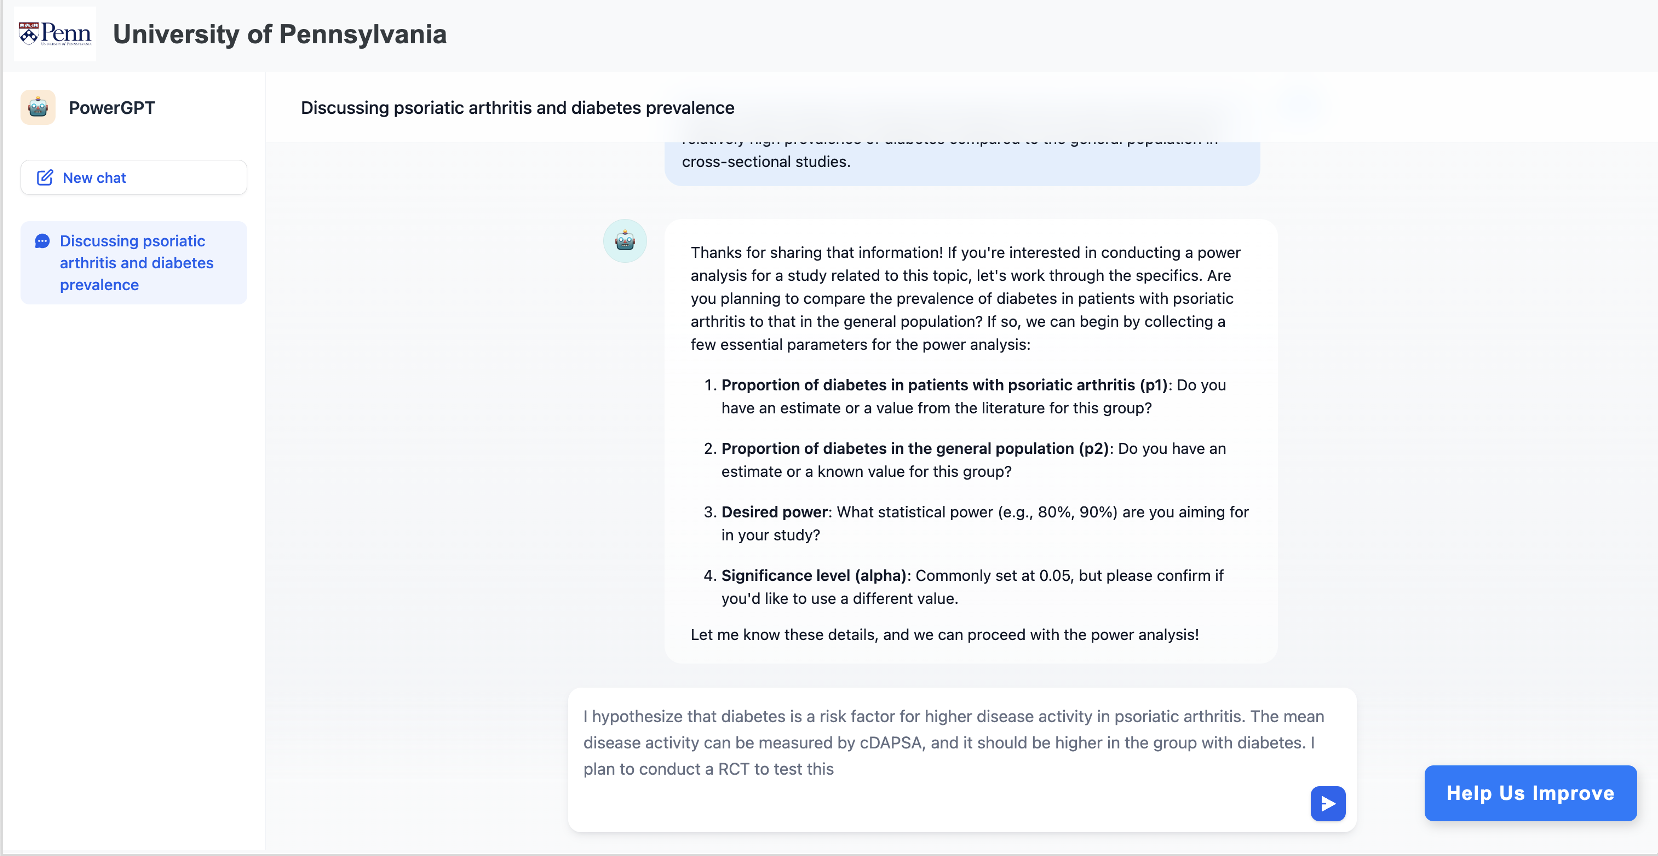
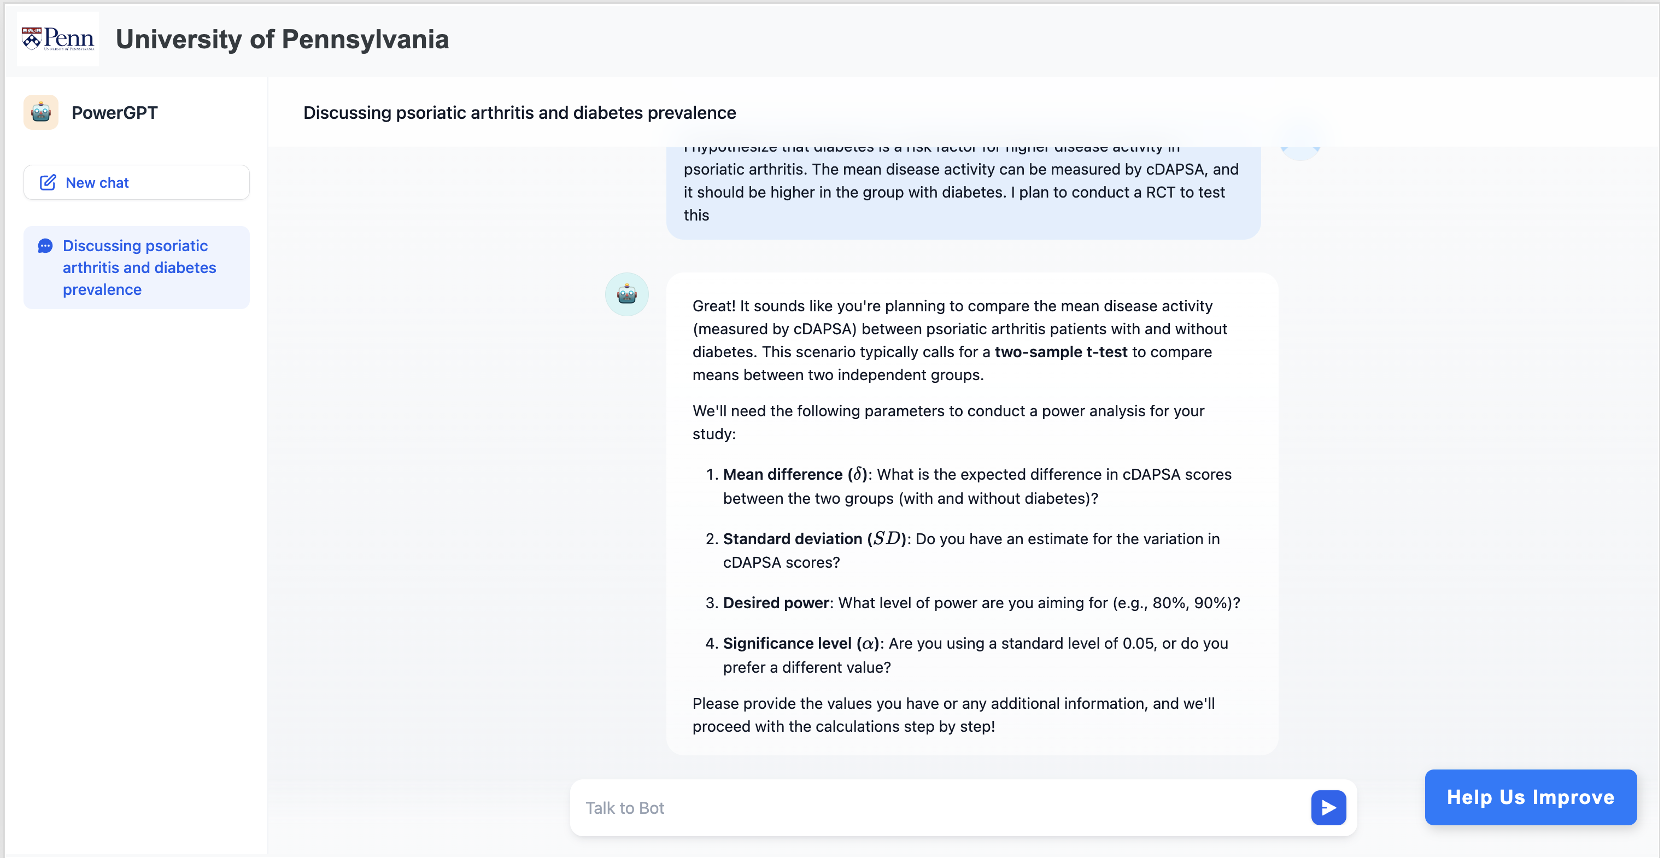
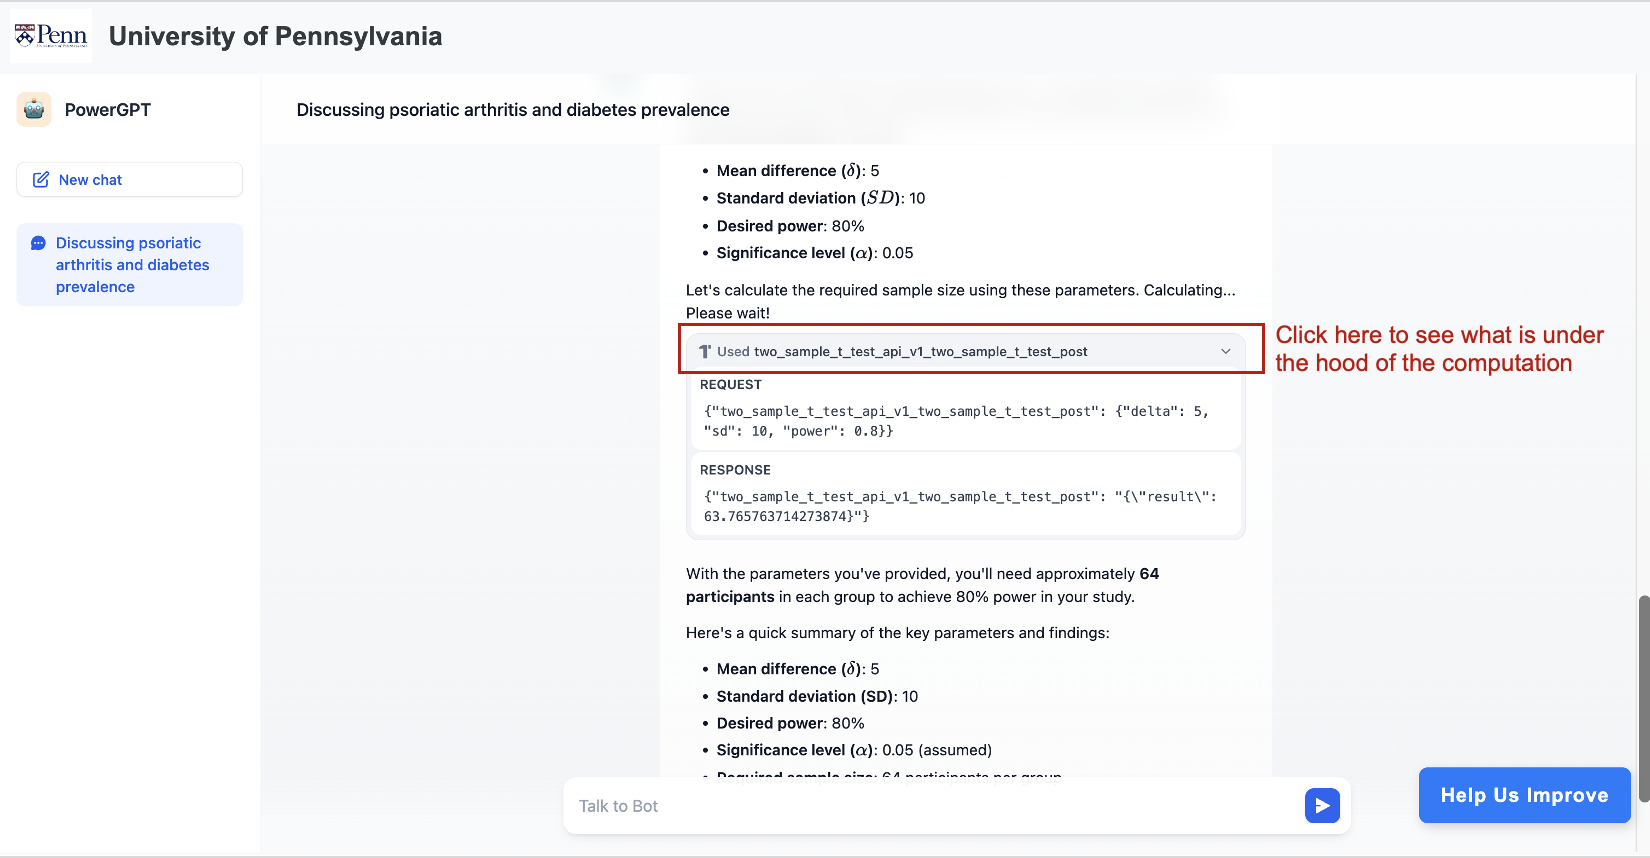
Welcome To PowerGPT
PowerGPT is an intelligent assistant designed to guide researchers through power analysis for their studies. It provides clear, step-by-step explanations to help you calculate sample sizes, determine statistical power, and understand key concepts in your research design.